
The non-negotiable for any clients we work with is that there is a comprehensive financial model (forecast) developed and approved before any further work is completed. There are many business planning documents including Business Plans, Marketing Plans and Strategic Plans. All these documents can add significant value, however often they are completed as a requirement rather than an essential document to assess business viability and performance.
Step 1 – Identify the key revenue drivers.
The financial model (forecast) is only as good as the assumptions that drive the model. The biggest mistake made (generally by professionals) is focusing on developing a fancy model rather than researching the underlying business assumptions.
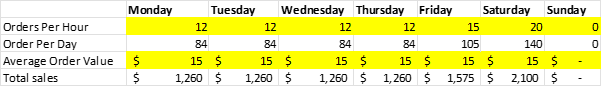
Example – Small Café
Key Drivers
- Number of orders per day of week
- Average order value
Considerations:
- Historical results
- New Start-Up (Sit in competitor cafes and assess comparable size / fit out / menu offering and observe customer orders during peak and non-peak trade periods)
- Menu offering
- Pricing
- Trading hours
Step 2 – Identify Key Expenses
There are two options to identify key expenses, if you have an existing business and menu offering you can apply known key costs such as rostered labour expenses. Alternatively, to initially complete a basic forecast you can start with accepted industry benchmarks.

In a real-life situation, you will plug in the known costs at a minimum, these include rent (as per lease or spaces being looked at).
Step 3 – Put the forecast together.

Step 4 – Sense Check and Scenario Analysis
In this example, the cost of sales and cost of labour assumptions are critical to the viability of the café. Therefore, develop an example labour roster by proposed shifts, and consider the assumed orders per hour and sales mix to determine the reasonableness of the assumption.
Investigate competitor benchmarks as an important point of comparison, sources such as the ATO are a good starting point.
Completing basic scenario analysis will help drive basic business decision-making:
- $1 increase in average order value = $30,212 increase in sales / $3,323 increase in profit
- 1% increase in labour costs = $4,532 reduced profit
- 1 Additional Order Per Hour = $32,760 increase in sales / $3,603 increase in profit
Step 5 – Reporting
Once the forecast has been checked and accepted lock the budget in for the next financial year. Periodically check performance against set assumptions and where results are unfavorable determine what can be done to get key assumptions back to the required level.
For example, common levers that can be pulled may include:
- Adjusting pricing of key items (Coffee, Pastries)
- Negotiate better pricing with suppliers or move providers.
- Change the menu offering.
- Change the labour mix (Casuals, Part Time, Full Time and Incentives)
The above forecasting guide is provided as a simplistic example of how to set up a basic forecast and more importantly how to utilise the forecast to improve business performance. If you want assistance in developing your forecast or key business documents reach out to the team at TR Consulting for an initial free consultation.


